

Most smartwatches build your heart rate zones from an estimate: a predicted maximum heart rate, usually based on age, divided into fixed percentages. A lab VO₂ max test measures where your own body shifts gears as exercise gets harder, so your zones can be set around you rather than around an average. The best approach uses both. The lab sets your targets, and your wearable tracks them day to day.
Key takeaways
- Wearables estimate peak heart rate and VO₂ max with proprietary algorithms. Sometimes those estimates are close. Sometimes they are not.
- A lab test measures oxygen uptake, carbon dioxide output and heart rate as the workload rises, which reveals two personal thresholds: VT1 and VT2.
- Those thresholds define training zones more precisely than percentages of a predicted maximum heart rate.
- Heart rate is useful, but it is not a direct stand-in for VO₂. Heat, humidity, altitude, sleep, stress and medications can all shift it.
- Entering lab-based zones into your wearable, and cross-checking with how hard the effort feels, makes everyday tracking far more meaningful.
How do wearables estimate heart rate zones and VO₂ max?
Wearable devices have made heart rate training far more accessible than it was before the wearable boom. They have improved a great deal, but they come with caveats worth keeping in mind. Most popular watches now estimate your peak heart rate and VO₂ max, along with metrics like heart rate variability. So how do they do it?
Most wrist and finger devices use photoplethysmography: an LED shines light onto the skin and measures the reflection as blood pulses through nearby vessels. Chest straps use electrical sensors instead. The device then runs a proprietary algorithm to estimate aerobic fitness, or VO₂ max, typically by combining your heart rate response during exercise (often relative to your pace or power) with profile details such as sex, age, weight and sometimes height. Sometimes the result is quite accurate. Sometimes it isn't. Research reviews of consumer wearables have found that their VO₂ max estimates can differ meaningfully from lab measurements (Molina-Garcia et al., 2022).
| Optical and electrical sensors | Inertial sensors | |
|---|---|---|
| What they use | Photoplethysmography (optical) or electrocardiography (electrical) | Accelerometers, gyroscopes and magnetometers |
| Common examples | Apple Watch, Garmin, Polar, Wahoo, Fitbit, WHOOP, Oura | Catapult, RunScribe |
| Where worn | Chest, wrist or finger | Torso or lower body |
| What they measure | Heart rate, heart rate variability, sleep patterns | Movement, acceleration, deceleration, change-of-direction workload |
| Who uses them | Fitness enthusiasts and athletes, the general population, clinical populations | Athletes in multidirectional sports; runners tracking foot strike, pronation and ground reaction forces |
For a closer look at why a watch estimate and a lab result can disagree, see VO₂ Max Testing vs Wearables: Why Lab Data and Watch Estimates Can Differ.
What does a lab VO₂ max test actually measure?
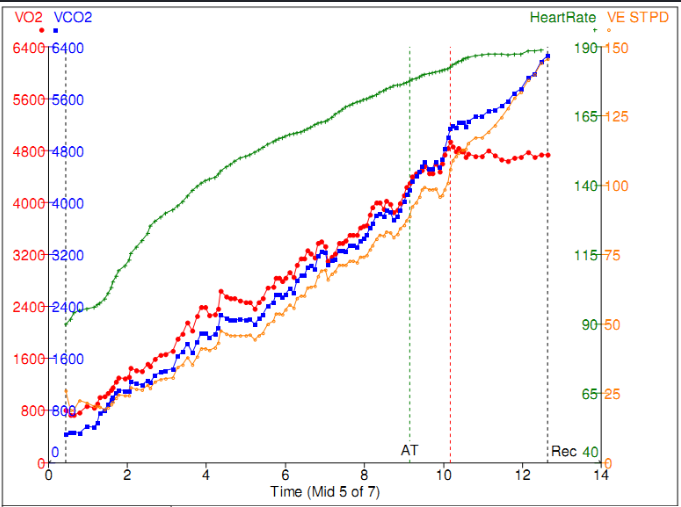
If you are new to the metric, start with What Is VO₂ Max? A true measure of VO₂ max and peak heart rate starts before the exercise does. First, we record the temperature, barometric pressure and humidity of the testing room, and calibrate the oxygen (O₂) and carbon dioxide (CO₂) sensors to confirm the measurements are accurate.
The test itself uses a workload that gets progressively harder. Throughout, we measure oxygen uptake, CO₂ output, heart rate (by full ECG or a chest-worn monitor) and your rating of perceived exertion (RPE), meaning how hard the effort feels. This shows how your body responds at each step up in workload, all the way to maximal effort, and it captures the most accurate heart rate measurements along the way.
How we confirm a maximal test
A few checkpoints confirm a good-quality test:
- The respiratory exchange ratio (RER), the ratio of CO₂ produced to O₂ consumed (VCO₂/VO₂), rises above 1.1.
- Oxygen uptake and heart rate level off and stop rising, even as the workload keeps increasing.
- RPE reaches maximal effort, or you are no longer able to continue the workload.
What are VT1 and VT2, and how do they set your zones?
Because the data is continuous, we can see inflection points: the point where the rate of CO₂ output starts to tick up, and a second point where it rises sharply. These are the first and second ventilatory thresholds, VT1 and VT2. They mark where your body leans more heavily on carbohydrate to keep up with the rising workload. This is how we identify your training zones, along with your aerobic capacity.
| Zone | Where it sits | How it feels (RPE) | RER |
|---|---|---|---|
| Zones 1–2 | Below VT1 | Easy to moderate | 0.70–0.88 |
| Zone 3 | Between VT1 and VT2 | Moderate to hard | 0.88–0.95/1.0 |
| Zones 4–5 | Above VT2 | Very hard to maximal | Above 0.95/1.0 |
You may notice that I did not put heart rate ranges in this table. That is because they vary from person to person. Many people have a true maximal heart rate that is higher than a prediction equation suggests, and some have one that is lower (Tanaka et al., 2001). True peak heart rate can also change with fitness level and with certain clinical conditions.
Here lies the difference between measured zones and the zones most watches use. A watch starts with a peak heart rate estimated from a prediction equation, then sets zones as generalized percentages of that number. There are multiple steps, and room for error at each one.
Why heart rate alone can mislead
Heart rate is one of the most useful variables available for monitoring exercise, but it is not a direct measure of aerobic fitness. Two people can exercise at the same treadmill speed and incline and have very different heart rates. And two people can have the same heart rate while working at very different workloads.
Heart rate represents the cardiovascular response required to meet your body's current demands. VO₂ represents the amount of oxygen your body uses to meet those demands. The relationship between workload, heart rate and VO₂ is influenced by many factors, including these:
| Category | Factors |
|---|---|
| You | Age, fitness level, training status, body composition, exercise economy, muscle recruitment |
| Your day | Sleep, stress, hydration, caffeine, illness, medications, autonomic nervous system activity |
| Your environment | Temperature, humidity, altitude, air quality, weather |
| Your workout | Exercise modality, for example running versus cycling |
So heart rate should not be treated as a direct substitute for VO₂. We cannot control humidity, temperature, altitude or air quality when you train with a wearable. When those factors change how a workout goes, heart rate will not track VO₂ in a straight line. That is why your rating of perceived exertion matters as a cross-check when you target training zones out in the real world. For more on balancing device data with your body's own signals, see What Wearables Miss.
A real example: the same ride, two sets of zones
The value of a wearable grows when you pair it with the objective and subjective data from VO₂ max testing. Here is one cycling session, viewed two ways.
The goal of this ride was easy aerobic work in Zones 1 and 2, below VT1. With the watch's default zones, set as percentages of an estimated maximum heart rate, only half the ride appears to land there, and 17 minutes appear to fall in the two hardest zones. By that measure, the workout missed its target.
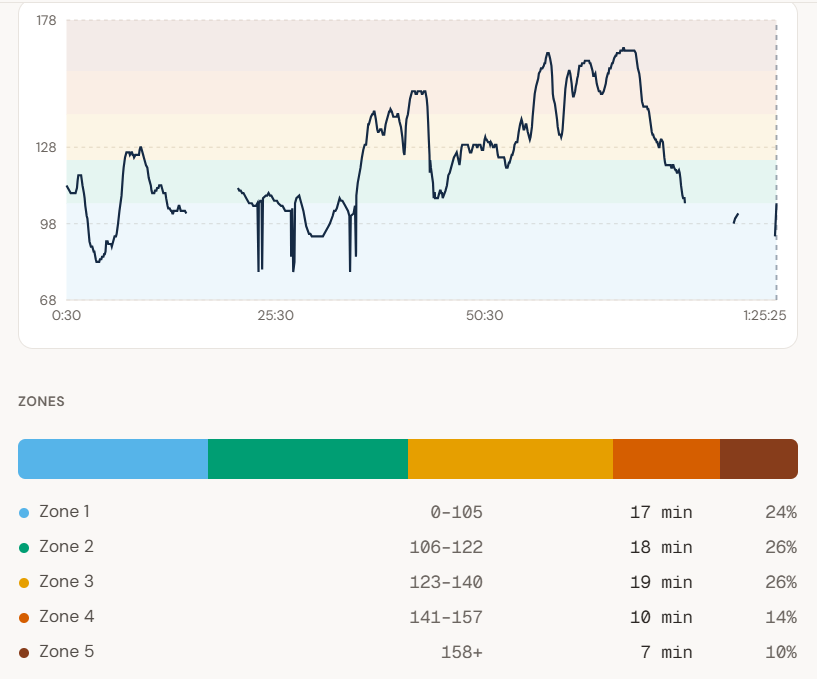
Now look at the same heart rate data after the zones were reset to the thresholds measured in the lab.
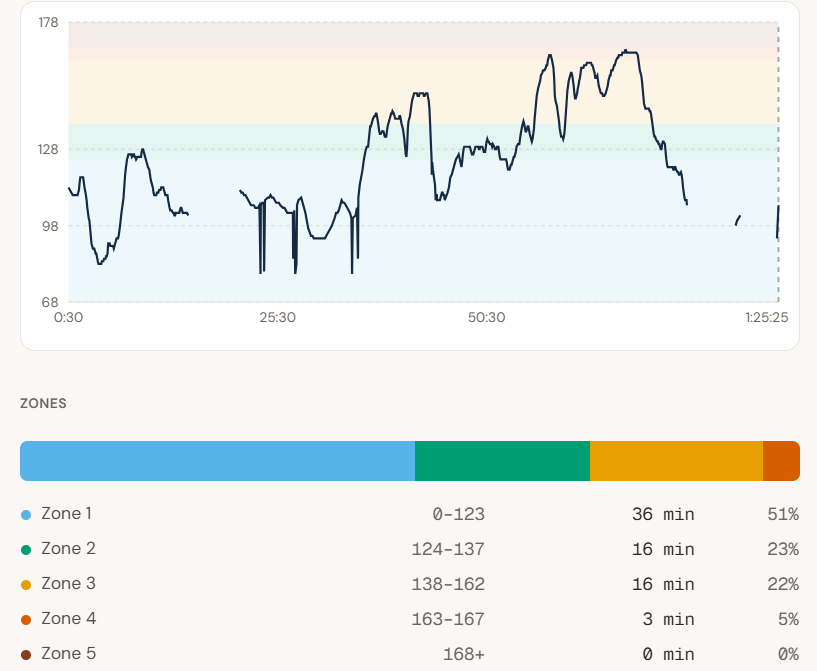
Same ride, different conclusion. Most of the session was spent where it was meant to be, with very little time at high intensity. The workout was productive after all.
How to use lab-based zones with your wearable
The key is using the two tools together. The lab test sets your personal targets. The wearable tracks them every day.
- Measure. A lab VO₂ max test identifies your thresholds, your aerobic capacity and your true peak heart rate. To see how aerobic capacity compares across age groups, read What Is a Good VO₂ Max Score?
- Personalize. Enter your threshold-based heart rate ranges as custom zones in your device's app instead of relying on the default, age-based settings. Most major platforms let you set custom zones or a custom maximum heart rate.
- Monitor. Train with your wearable, and cross-check with how hard the effort feels, especially in heat or humidity, at altitude, or when you are short on sleep or unwell.
- Reassess. Retest as your fitness, training or health changes so your zones keep pace with you.
Lab measurement, then an individualized physiological profile, then wearable monitoring, then reassessment over time. The difference between measurement and estimation is the key to using both tools well.
How PrimaryMD uses this
At PrimaryMD, exercise testing and wearable data are one part of a larger picture. Your physician remains accountable for medical decisions, and our exercise physiology team translates test results and wearable trends into practical training guidance, interpreted alongside your medical history, medications, recovery and goals. Learn how PrimaryMD membership works.
References
- Tanaka H, Monahan KD, Seals DR. Age-predicted maximal heart rate revisited. Journal of the American College of Cardiology. 2001;37(1):153–156. Read the study
- Molina-Garcia P, et al. Validity of estimating the maximal oxygen consumption by consumer wearables: a systematic review with meta-analysis and expert statement of the INTERLIVE Network. Sports Medicine. 2022;52:1577–1597. Read the study